How ADPRI constructed the Employee Motivation and Commitment Index
September 06, 2023
For nearly a decade, ADPRI has been collecting granular data on individual workers from a stratified random sample of people worldwide. In surveys of more than 490,000 workers in 29 countries, respondents have shared their feelings about their jobs, their colleagues, their organizations, their pay, their leaders, and many other workplace issues.
Our study reaches knowledge and shift workers at all levels of income and managerial responsibility across dozens of sectors.
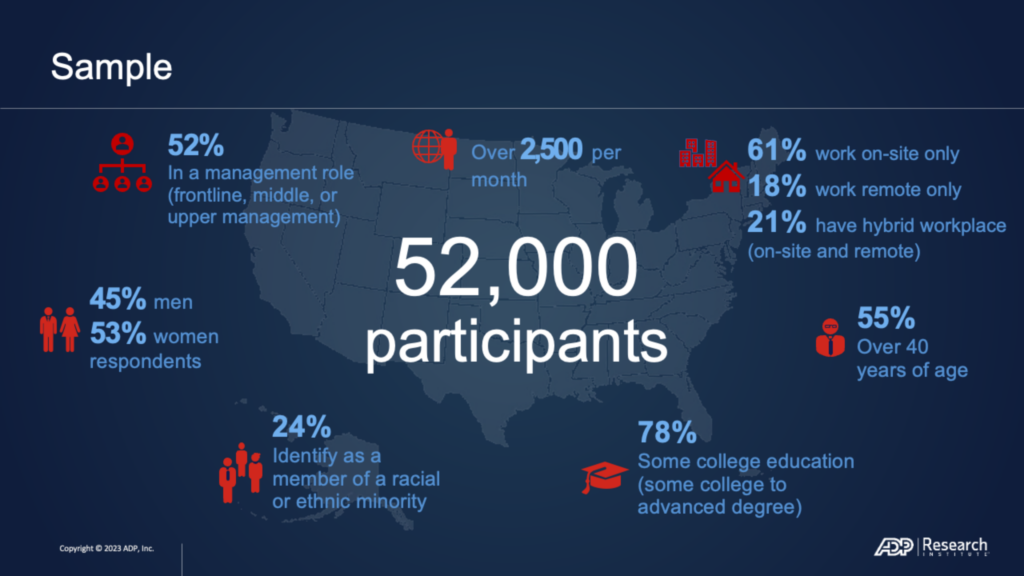
In December 2021, we began collecting responses from 2,500 workers in the U.S. every month. This survey contains more than 50 items, statements that workers are asked to respond to on a five-point scale. Certain items then are packaged to create tools that measure a worker’s experience on the job: engagement, resilience, and connection.
- Engagement – The proactive frame of mind that enables a worker to give their best. (8 items)
- Resilience – The reactive frame of mind that enables a worker to withstand obstacles and bounce back. (10 items)
- Inclusion – The connections a worker has to their colleagues and their organization. (12 items)
The 30 items that make up these tools were constructed using:
- A single thought to avoid muddying what is being measured.
- Extreme wording to evoke strong responses.
- A “me rating me” technique to minimize the error associated with the idiosyncratic rater effect, that is, the tendency of people to be unreliable raters of others.
The three tools measure psychological constructs and can help organizations better understand employee behavior.
In simple terms, groups of items work together to describe intangibles such as stress, attitudes, personality characteristics, engagement, and happiness.
Why build this tool now?
How and where we work has changed dramatically over the last three years. The search for and retention of top talent has become a leading focus for most industries.
We set out to build a tool that could identify people who have no intent to leave their jobs and who feel connected to their work, their colleagues, and their employer. We wanted to find the sweet spot, of optimal functioning in the workforce.
Analysis
Examining the U.S. and global data derived from our three tools, we ran statistical analyses to identify which survey responses could be combined to create a single, unified measurement of motivation and commitment, the EMC Index.
One criterion for selection to the EMC Index was to examine the intent to leave of the respondents. Our monthly pulse survey contains the following question:
Which of the following best describes your desire to work for a different company?
- No intent to leave my current company
- Not actively looking but would consider a new company if contacted by a recruiter or saw an opportunity
- Actively looking for a new job
- Actively engaged in the interview process for a new job
- Not sure
We hypothesized that if individuals have no intent to leave their current job, they will feel connected to their colleagues and the organization. This was our starting point for inclusion in the Employee Motivation and Connection Index.
Further analyses revealed the relationships between the survey responses and external criteria to understand each question’s explanative power. The EMC Index is coded with a binary classification based on how positively people responded to the survey questions. Those who responded with positive answers with high frequency received a score of high motivation and commitment.
Ultimately, we chose nine items to build our EMC Index algorithm, assigning different weights to each. Given that the outcome variable was binary, we completed a logistic regression with a second sample to understand the sorting prediction power of the items. We found that the items chosen separated the actual leavers from the non-leavers 73 percent of the time, which is good.
ADPRI is committed to learning about the use of these tools in a global context. As we learn more, we’ll share our findings.
Sample size and makeup
Our monthly survey collects responses from a cross section of working adults in the United States. Since December 2021, we’ve collected more than 52,000 responses.


